Goals and Objectives
An important part of any project is obtaining the data. If one is not getting data from credible places, any analysis may not be justified or worthwhile. The main goal of this lab exercise was to become familiar with the process of downloading data from different sources on the internet, importing data to ArcGIS, joining data together, and projecting data from these different sources into a single coordinate system that makes sense while building and designing a geodatabase to store the data.
General Methods
The first site that data were acquired was the nationalatlas.gov, which is where the DEM data was downloaded. DEM (digital elevation model) data can easily show high and low areas in the area of interest. By default, the areas of high elevation are white and low elevations are shown in black.
 |
| Two DEM files that were mosaicked together to form a seamless image. |
One important site used to obtain data was the USGS National Map Viewer.
 |
| This is the first view of the National Map Viewer from the United States Geological Survey page. |
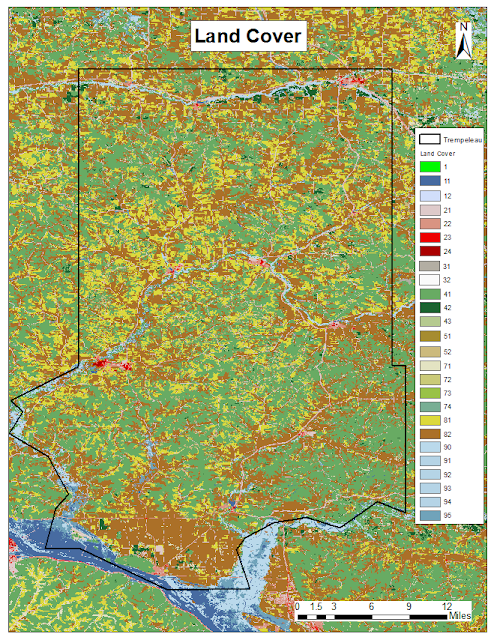
This is a very useful site for many different applications of data, such as man made structures (like public attractions, medical facilities, education, etc.), transportation information, governmental boundaries, hydrography data, land cover, elevation, and imagery. We used land cover data in the Trempeleau County area.
We also used the USDA NRCS Web Soil Survey to download SSURGO data, which just stands for soil survey geographical.
 |
| This is what the general soils map of Tremeleau County looks like. I did not include a legend because the breakdown of the soils is too complex in this system. |
 |
| This a more zoomed in view of an area in Trempeleau County (reference map) just to show how detailed the soil can be over a small area and how complex the patterns can be. |
Results
In order for all the data to show up in its proper location, each piece of data needed to be in the same coordinate system. To do this, the tool define projection must be run on all the data using the same coordinate system. I decided to use the NAD_1983_HARN_WISCRS_Trempealeau_County_Meters because it is focused around the study area of Trempeleau County. Once all the data have a defined projection, then the project tool must be run on all the data, so they all show up in the data frame in the same coordinate system, and so that everything appears to be in the correct location relative to each other.
 |
| Here are both maps of the land cover data and the soil survey data overlain by the main roads layer in bright red. |
Conclusion
This lab opened up the door for endless future possibilities at retrieving data. There are so many resources to be tapped, and that number is increasing as technology becomes more and more available to the average person. While putting this data together, I also worked on building a geodatabase with many different file types. A lot of files can be created once data needs to have a defined projection and needs to be projected, so it is important to keep organized for these projects. Getting data from multiple sources means the data will probably not be in the same projection, so it is essential to pay attention to details like that when showing many kinds of data.

No comments:
Post a Comment